The Carbon footprint in… your fridge!
Yellow Tree recently undertook a carbon footprint assessment for a large, multi-national player in the poultry industry. In writing the report, we uncovered some fascinating information about the carbon footprint of various foods.
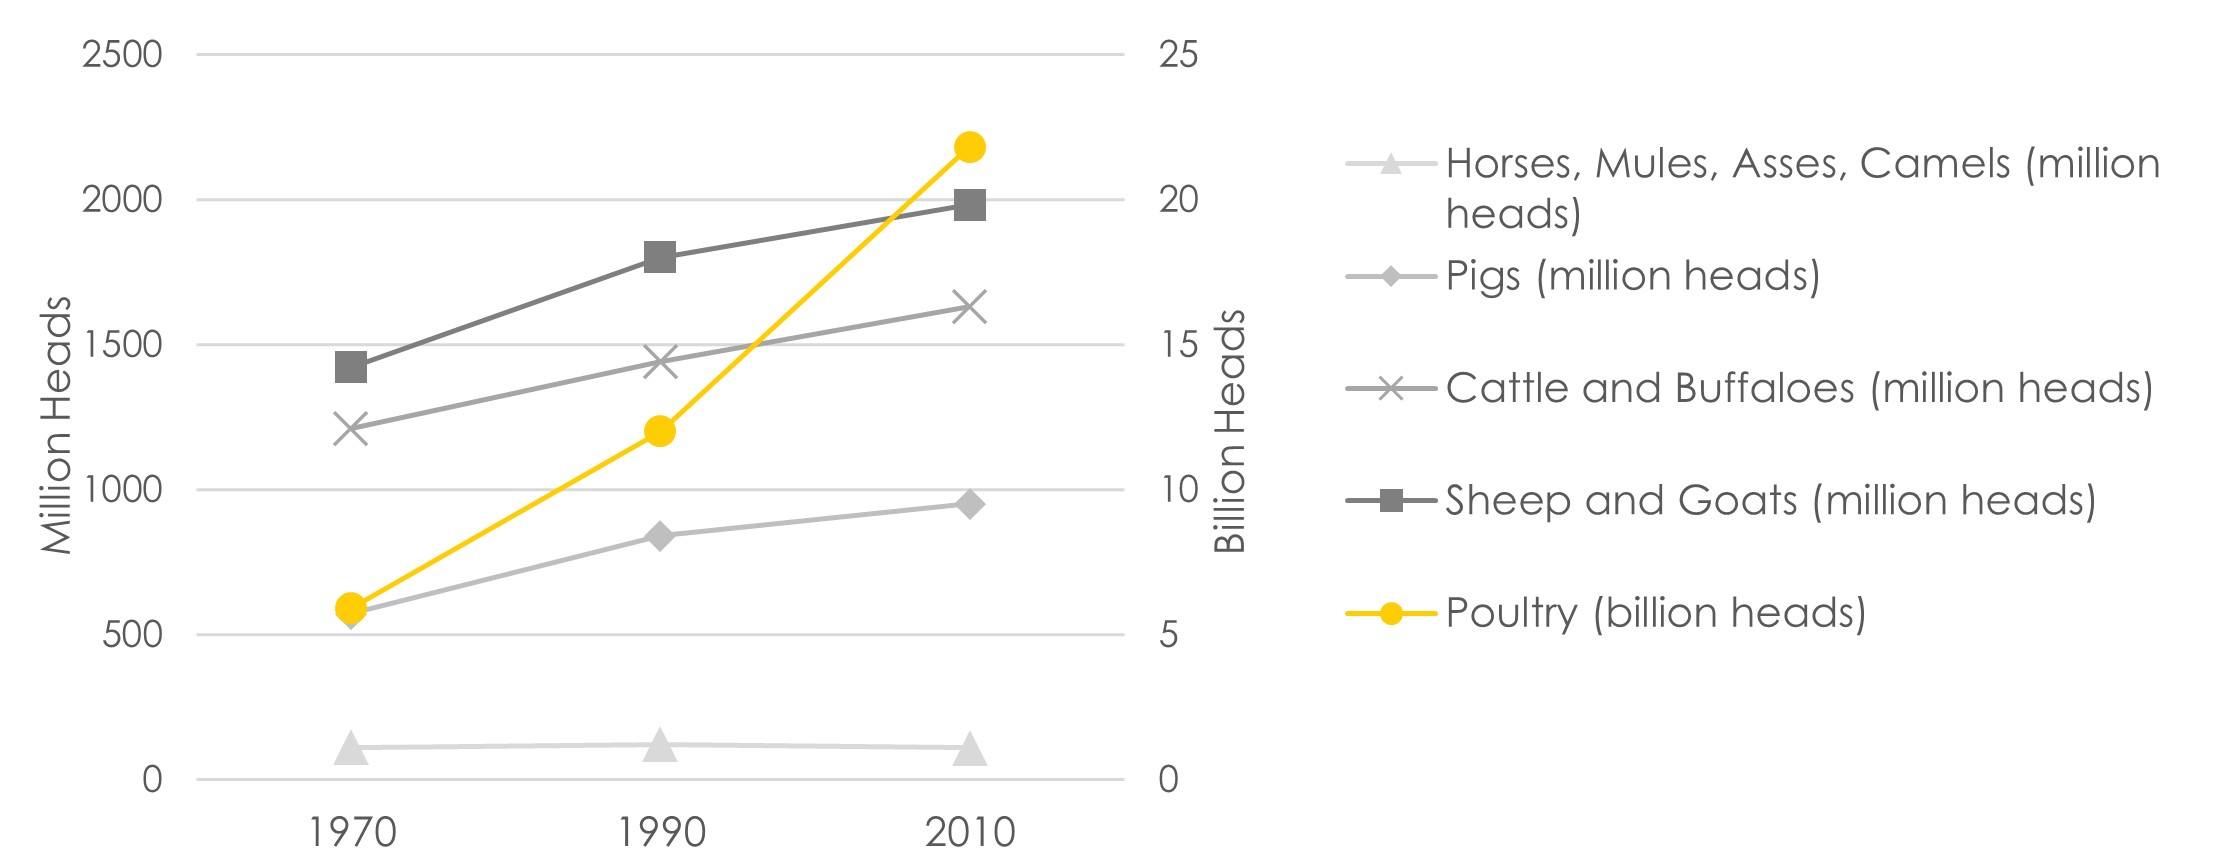
As expected, there has been a consistent global rise in livestock production over the years, which is illustrated in Figure 1 below. Between 1970 and 2010, there was a 370 % increase in the farmed poultry population; a 140 % increase in the number of cattle, sheep, and goats; and a 160 % increase in the number of pigs. The growth in livestock production has resulted in an increase in the volume of greenhouse gases (GHGs) being released into the atmosphere. It is noteworthy that animal agriculture is responsible for 14.5 – 16.5 % of global GHG emissions1.

Figure 1: Global Livestock Production from 1970 to 2010
IPCC, Agriculture, Forestry and Other Land Use (AFOLU) Ch.11
Animals with ruminant digestive systems, such as cattle, sheep, and goats, produce large volumes of methane, which is released as flatulence. These large volumes of methane are produced as a result of enteric fermentation which occurs in the guts of the animals. Additionally, ruminant animals have higher feed requirements and require large tracts of land for grazing2. The farming of poultry avoids these problems and thus poultry has a comparatively low carbon footprint when compared to other livestock.
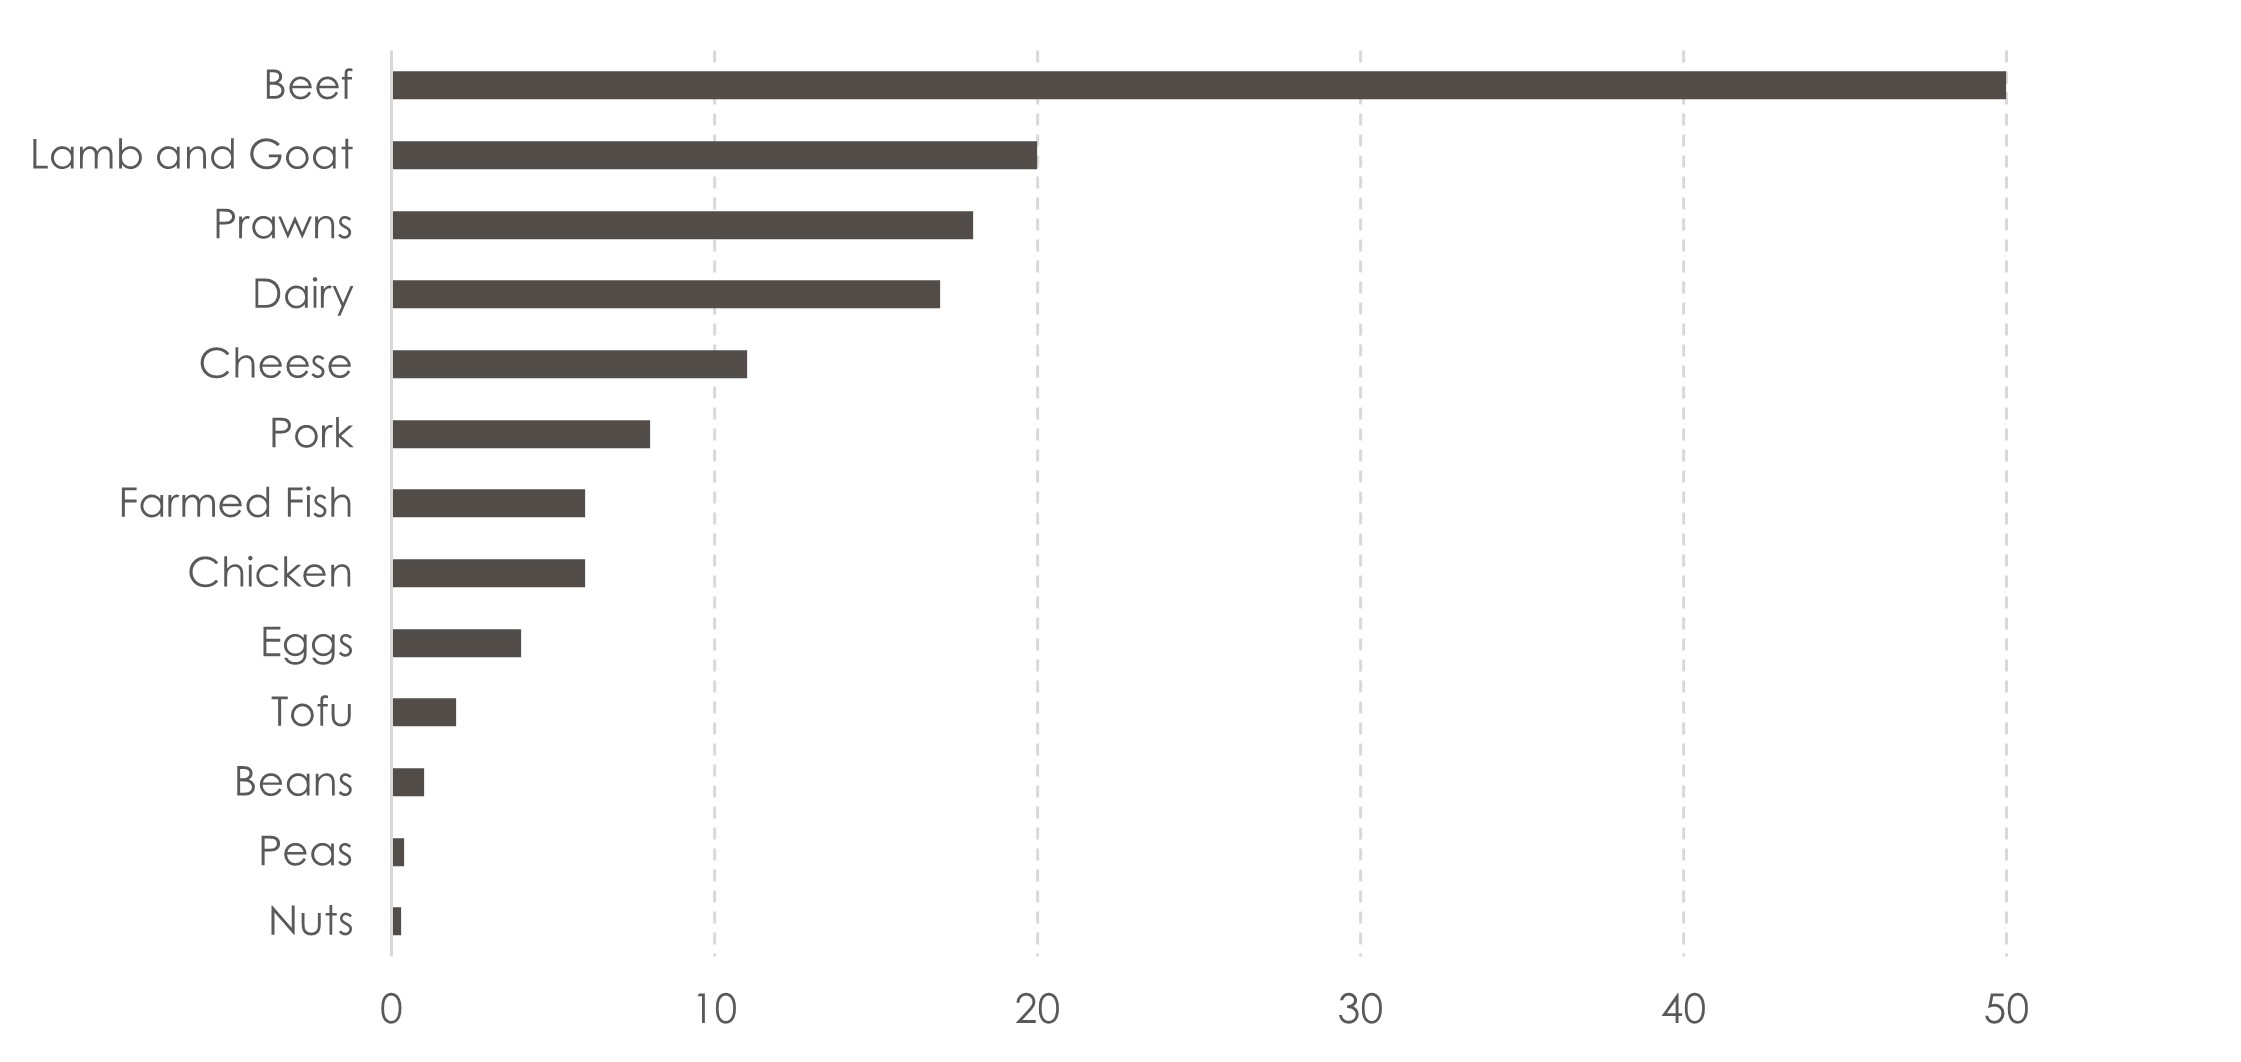
The following two graphs (Figure 2 and Figure 3) show the emissions that are released during the production of various foods. As shown, the processing of beef, lamb, dairy, and cheese has a large carbon footprint when compared to that of poultry farming. Additionally, it is evident that vegetarian diets provide protein at a mere 5 – 10 % of the carbon footprint of chicken and provide protein at a mere 0.3 – 1 % of the carbon footprint of beef!

Poore and Nemecek, 2018

Poore and Nemecek, 2018

Figure 4: Environmental Impact of One Glass (200 mL) of Different Milks
Guibourg and Briggs, 2019
It is interesting to note that South Africa is one of the world’s leading consumers of chicken, ranking 10th in the world for the consumption of chicken in absolute terms (i.e. not per capita) in 20193. Each South African consumes, on average, 33 kg of chicken per year and 17 kg of beef per year.We hope that you have enjoyed learning about which foods have the lowest carbon footprints. At Yellow Tree, some of our staff have chosen to follow vegetarian and vegan diets, while others have simply focused on meat minimisation or plant-based diets to serve the environment while still incorporating meat into their weekly meal plans.
Just as carbon footprinting can help us adjust our diets, it can help identify methods of operating more sustainably in business too. A carbon footprint is an estimate of the amount of GHGs that are emitted, both directly and indirectly, in daily business operations. GHGs trap heat in the atmosphere, thus causing global warming. The aim of carbon footprinting is therefore to assess the extent to which a company contributes to global warming, and what can be done to reduce a company’s impact.
A subsequent intervention plan guides a company towards decarbonisation. The value of these studies is that they represent good corporate governance. By displaying future-readiness and by tracking sustainability metrics, companies can attract local and foreign investors who understand the importance of decarbonisation.
As was said by business management thinker, Peter Drucker, “If you can’t measure it, you can’t manage it”. Quantifying one’s carbon footprint constitutes the measurement. Identifying areas of improvement and drawing up an intervention plan constitute the management. Many companies report their current carbon footprint and reduction goals as part of their annual Corporate Social Investment (CSI) reporting. In the US and UK, public carbon footprint reporting is mandatory for large companies.
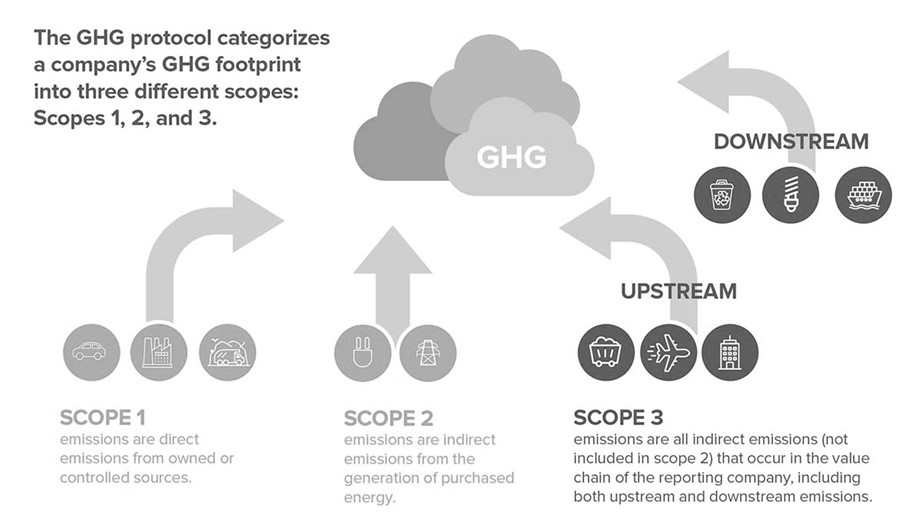
When conducting a carbon footprint, it is important to define where the operational boundary should be drawn. The operational boundary determines which emissions should be included in the assessment and which will be excluded. The operational boundary can include Scope 1, Scope 2, and Scope 3 emissions, as defined in Figure 5.

Figure 5: Direct (Scope 1) and Indirect (Scopes 2 and 3) Emissions
www.bsr.org
We would love to help you quantify your carbon footprint and to identify solutions that will enable you to decarbonise your organisation. By embarking on a decarbonisation journey, companies often increase their resilience against externalities that are outside of their control and reduce their operating costs.We are here to help!
