Part 2: Isokinetic Sampling
In accordance with NEMAQA
1. Introduction
You may hear the term “isokinetic sampling” often, but it is likely that no one has ever explained what isokinetic sampling is, when it is required, why it is important and how one does it. This document hopes to change that, and by the end you should have a simple and clear understanding of isokinetic testing. It is our hope that you will come back to this series of guides from time to time to refresh your knowledge. By diligently learning and growing together we can make South Africa’s air the cleanest in the world!
2. Concentration
Before we try and understand isokinetic sampling, we need to understand the concept of concentration. Even if you understand concentration, please take time to read this description beneath. It will provide you with a foundation of knowledge on which you can build for years ahead. Let’s start at the beginning. Every air pollutant is reported as a concentration. A concentration is the amount of something in something else. For example, if one makes chicken stock mixture at home, one would put two cubes (20 g) of chicken stock in 1 litre of water. The concentration is then 20 g per litre:
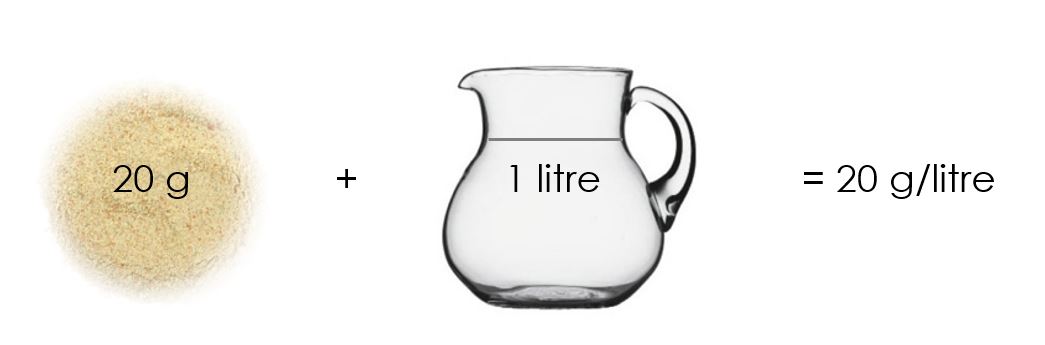
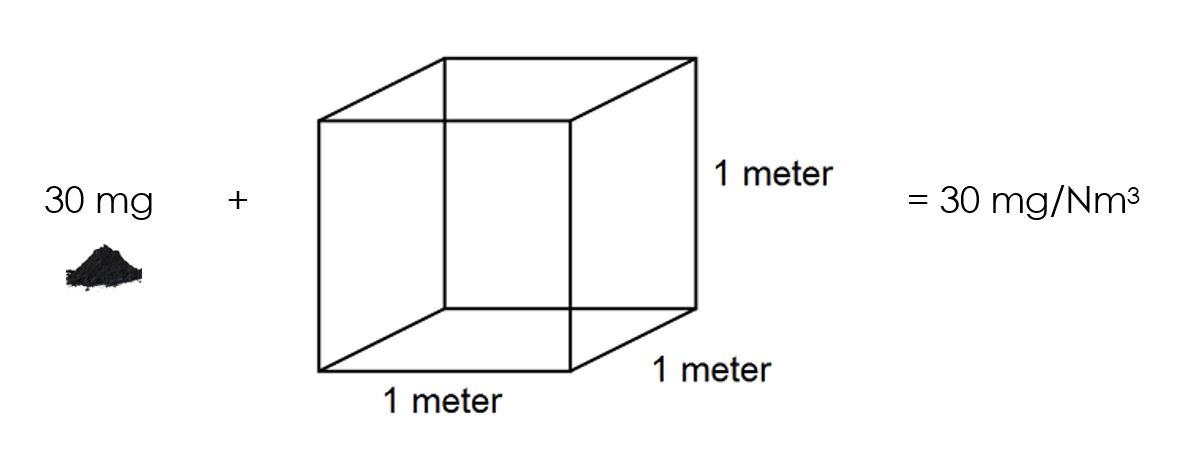
You will see that this concentration is expressed as a mass (of chicken stock) per volume (of water). The air quality legislation is exactly the same. It expresses the mass of particulate matter (PM) per volume of gas. A limit of 50 mg/Nm3 means that there are 50 mg of PM in one cubic meter of air. A cubic meter of air is 1 000 litres and is roughly the volume of space underneath your desk at work:
Now that we understand what a concentration is, let us consider how concentrations are measured. In the chicken stock example, you had to weigh the chicken stock on a scale, and you had to measure the volume of water in a measuring jug. You needed both these two measurements: mass of chicken stock and volume of water.
The same is true of air quality. You must measure the mass of the PM (mg) by drawing the stack gas through a filter to capture the PM. You must also measure the volume of gas that you draw (m3) using a dry gas meter (which is similar to the water meter outside your house). Then you will have the concentration in mg/m3. Lastly you will measure the temperature and pressure of the dry gas meter so that you can convert the volume that it reports in m3 to a normalised volume (Nm3) at standard temperature and pressure (0 ºC and 101.3 kPa). Then you have a concentration in mg/Nm3. So now that you are familiar with the concept of a concentration of air pollution, how does one measure the concentration in a way that is isokinetic? Let’s start with the meaning of “isokinetic”.
3. What does “Isokinetic Sampling” Mean?
Iso = the same as
Kinetic = velocity
Isokinetic sampling involves extracting the sample at the same velocity as the stack gas is travelling up the chimney stack or in a duct.
4. Why is Isokinetic Sampling Important?
If one were to put a pipe in a stack and extract a sample at a high flowrate, one may draw more gas than particles because gas flows more easily than the particles. Conversely, if one were to draw a sample from the stack at a slow flow rate, then one may draw less of the gas that surrounds the particles. In both instances, one is changing the concentration through bad sampling technique. Let’s go back to the chicken stock example and imagine that after making the chicken stock, one gets distracted by a phone call. The chicken stock mixture settles before one comes back to taste the mixture. Because the chicken stock has settled to the bottom of the jug, the sample is dilute and tastes bland. The concentration at the top of the jug has dropped. One has very little chicken stock and too much water in the sample in one’s teaspoon. One’s sample is not representative! One should stir the jug of chicken stock and then pour some into a teaspoon to get a representative sample. Unfortunately, many occupational hygiene companies in South Africa sample inaccurately. They attach a small pump to a filter and draw gas out of the stack. The small blue pump in the next picture is an example of this. This is not isokinetic sampling and is not representative. These results are of no value.
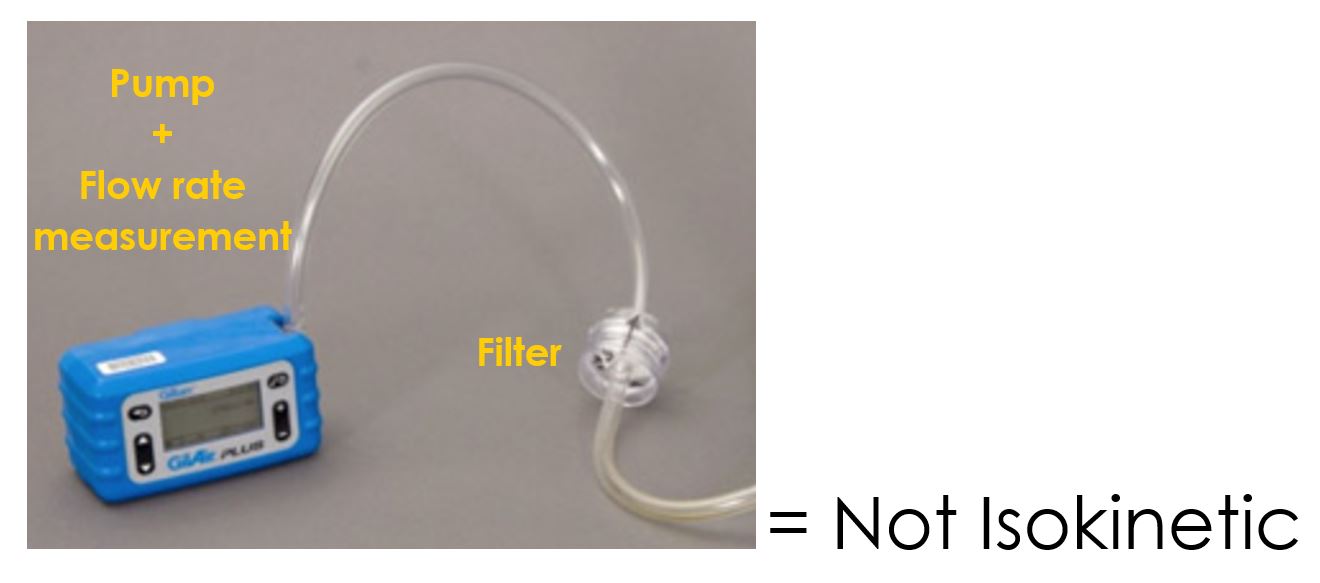
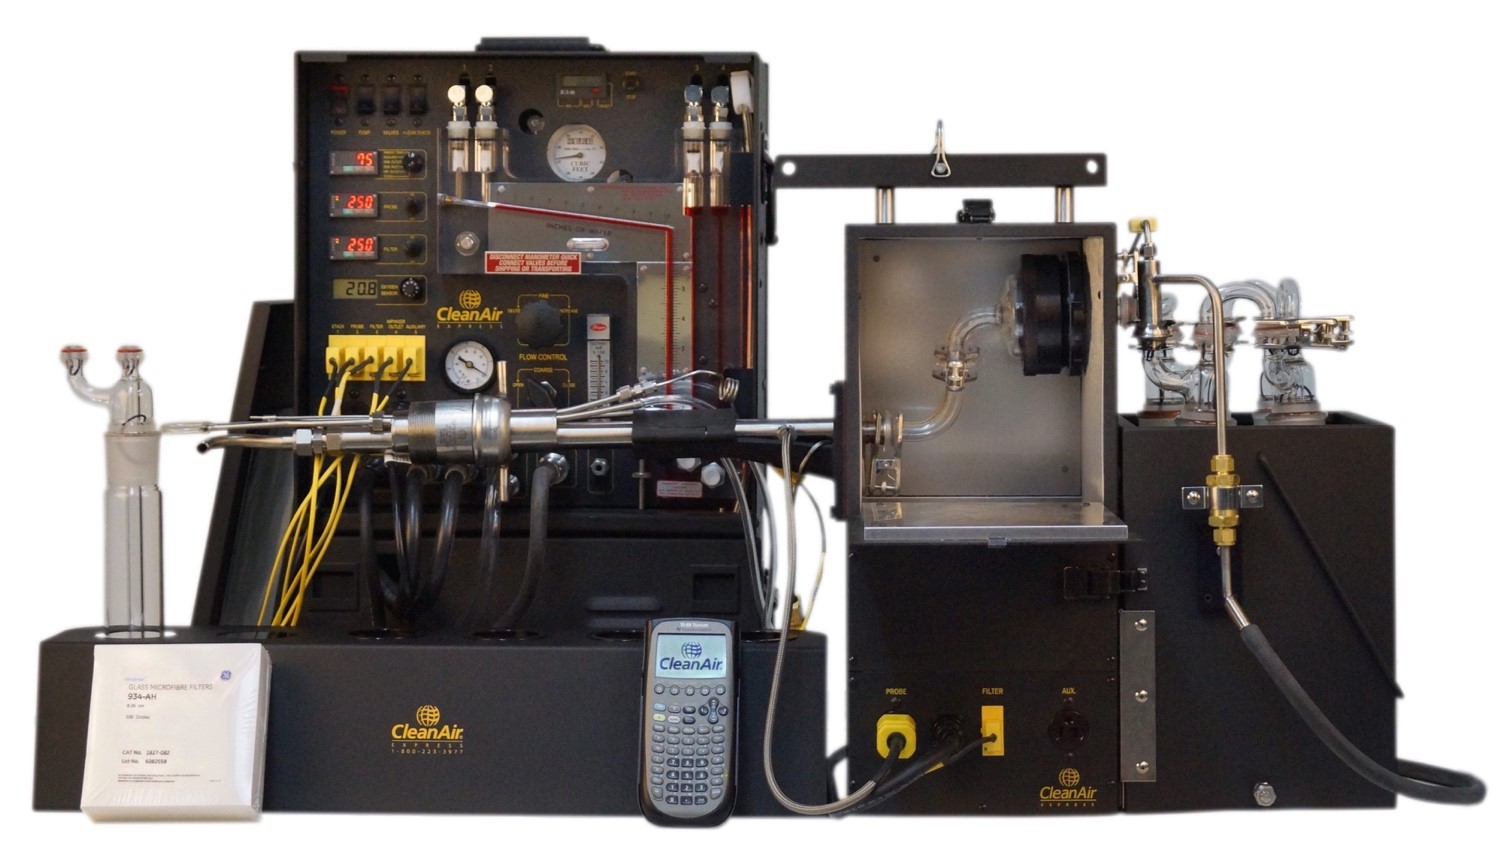
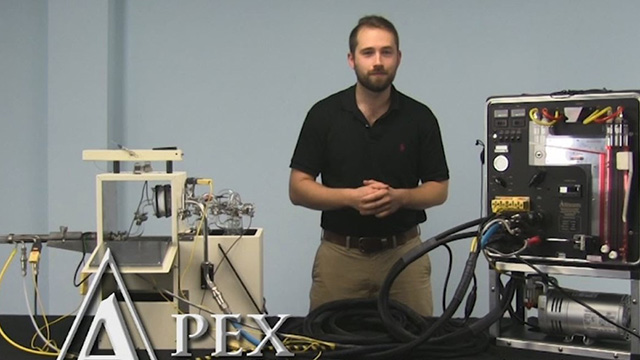
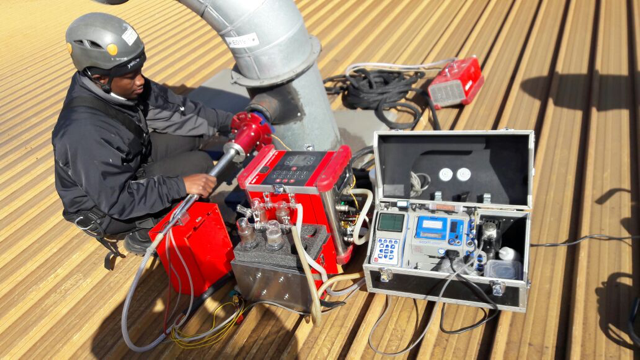
These companies often report emissions that are much lower than the actual emissions. This misleads Air Quality Officers. An example of this is a boiler stack in Boksburg where 3 737 mg/Nm3 of PM was measured when proper isokinetic testing was performed. This was expected as a coal fired boiler that is not equipped with any abatement equipment typically emits ± 3 000 mg/Nm3 of PM according to literature. Previously an occupational hygiene company had measured only 8 mg/Nm3 on this stack. Needless to say, the sampling method was not isokinetic and 8 mg/Nm3 is impossible. Often these misleading results can be detected if photos of the testing equipment are provided in a testing report. The small blue handheld pump shown above is unacceptable and is not compliant with EPA Method 5. Proper isokinetic testing equipment is shown in the two pictures that follow. This isokinetic testing equipment can weigh up to 100 kg.
5. What happens during Isokinetic Sampling?
For testing to be isokinetic the sampling nozzle must:
1. Point into the flow, and
2. The velocity entering the nozzle must be the same as the velocity in the stack.
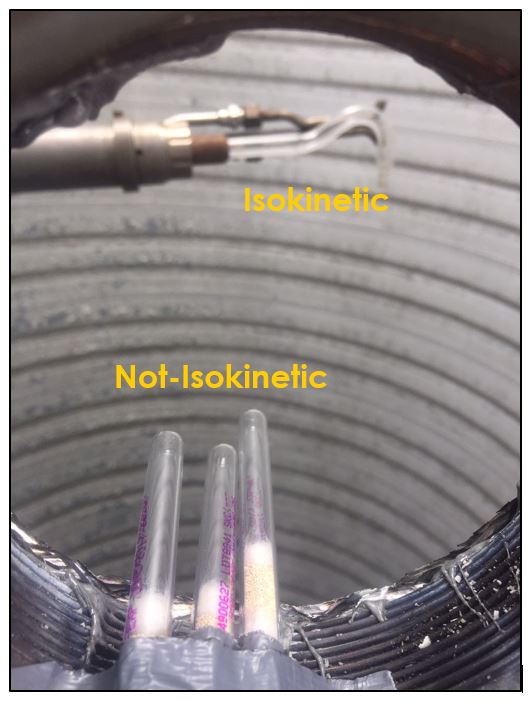
Let’s consider point 1. The photograph beneath shows the inside of a circular vertical chimney stack. In the background you will see a glass sampling nozzle facing downwards, into the upward stack flow. This glass nozzle is aimed correctly and is ready to sample isokinetically. The three sorbent tubes at the front of the picture are not sampling isokinetically as they are not facing the flow.
Now let’s consider point 2. The nozzle must extract the sample at the same velocity as the velocity in the stack. In Figure 1 below, the sampling velocity is exactly the same as the velocity in the stack. Sampling is therefore isokinetic. Only the gas that is directly beneath the nozzle enters the nozzle. The sampling process has not disturbed the flow or changed the concentration. In Figure 2, the nozzle is sampling gas at a higher velocity than the stack velocity. The nozzle therefore draws in more gas and fewer particles because particles have momentum and do not change their path as easily. A lesser mass of particles divided by a greater volume of gas results in a lower concentration being reported. In Figure 3, the nozzle samples at a slower velocity than the stack velocity. As a result, not all the gas that is directly underneath the nozzle can enter into the nozzle. Some of the gas diverts around the nozzle, but because of momentum, many of the particles that were entrained in that gas continue into the nozzle. Therefore, more particles are sampled, and an incorrect higher concentration is reported.
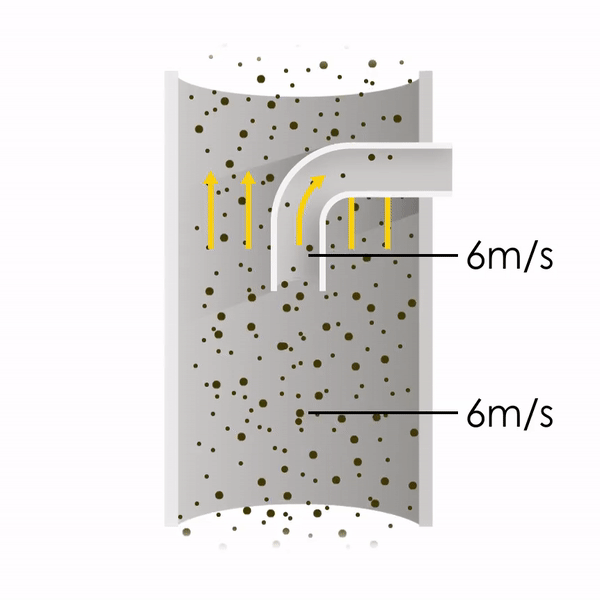
Figure 1
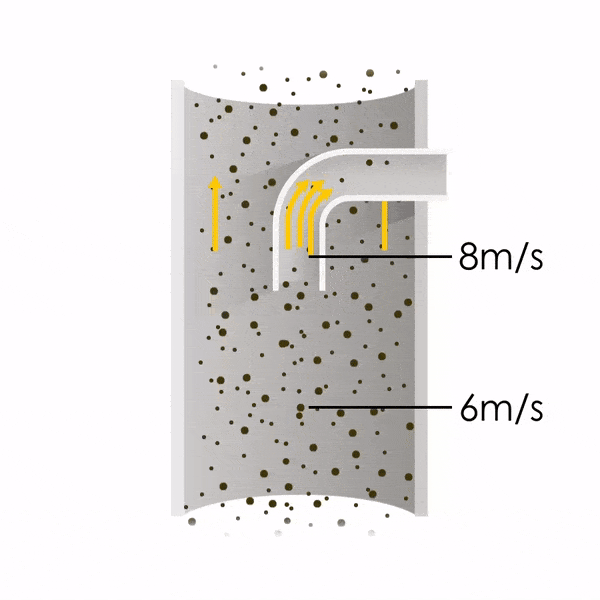
Figure 2
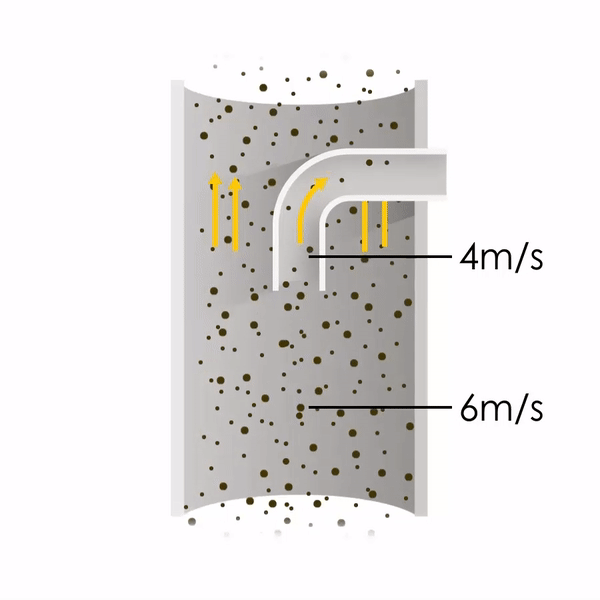
Figure 3
6. When is Isokinetic Sampling Required?
Isokinetic sampling is required when the pollutant is a solid or liquid and is entrained in a gas stream. Particulate matter is comprised of small solid particles. Metals are often also present as solids. PM and metals should be sampled isokinetically. If there are water droplets in the stack gas, and if the pollutant is soluble in water, then the pollutant will be present in the water droplets (e.g. SO3, HCl, HF, NH3, Cl2, and CH2O [formaldehyde]). These water droplets behave like particles and therefore one must sample isokinetically.
7. How does one Perform Isokinetic Sampling?
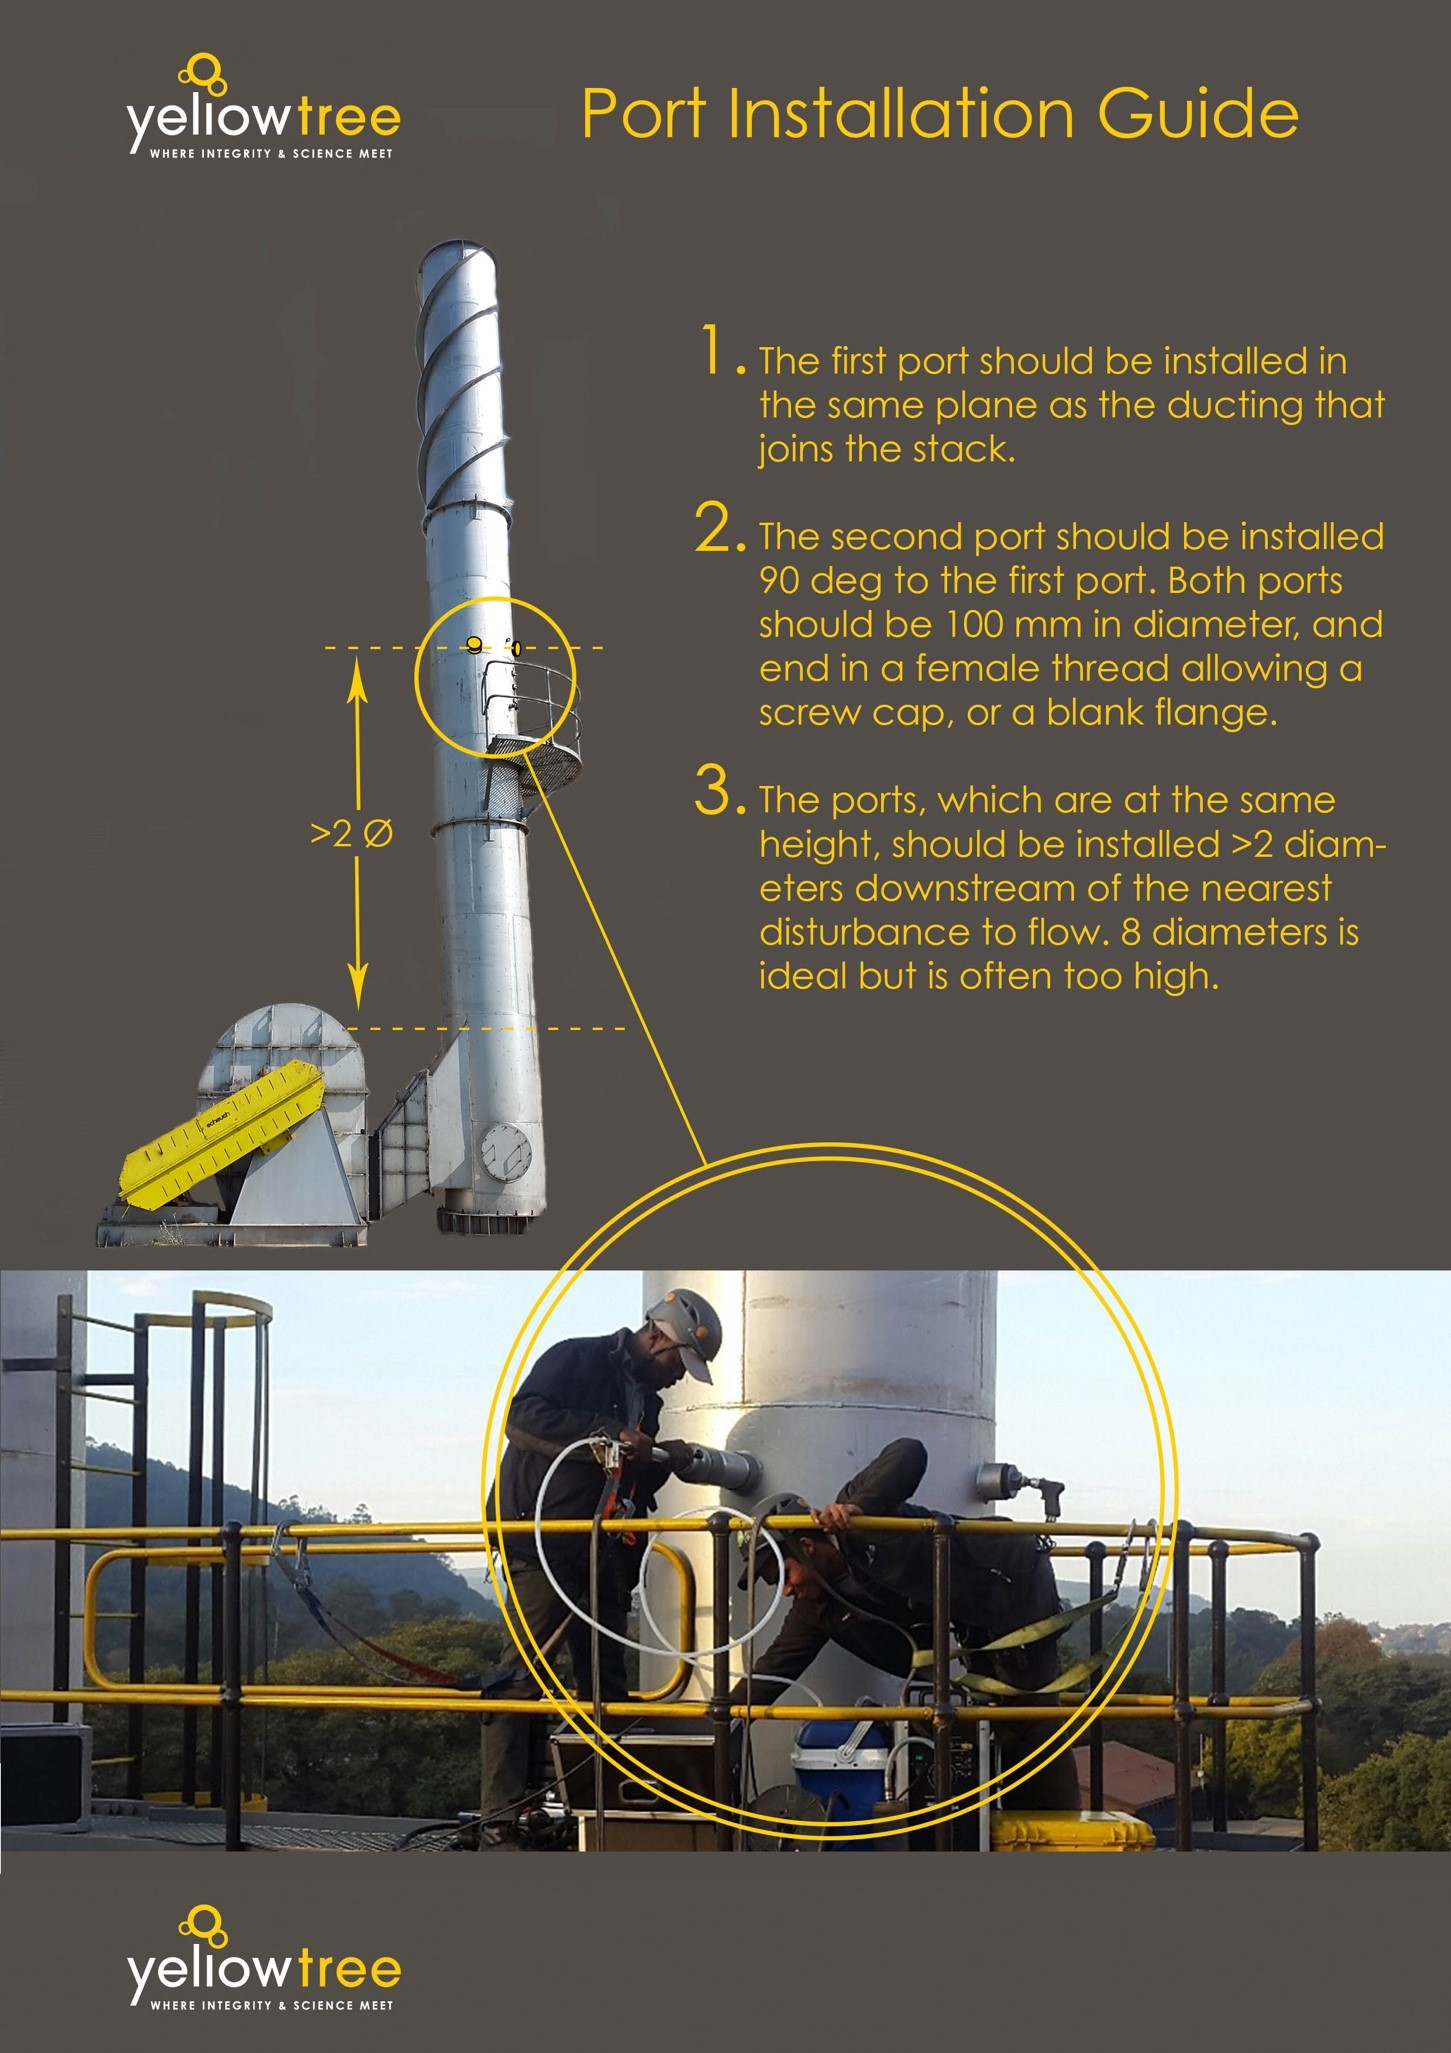
Firstly, the sampling must be conducted at the correct location on the stack. The ports must be located at least two diameters downstream from a disturbance to flow, and at least half a diameter upstream of a disturbance to flow. The exact criteria are explained in EPA Method 1. Testing should not be performed through only one port. The guide on the next page provides a concise overview.
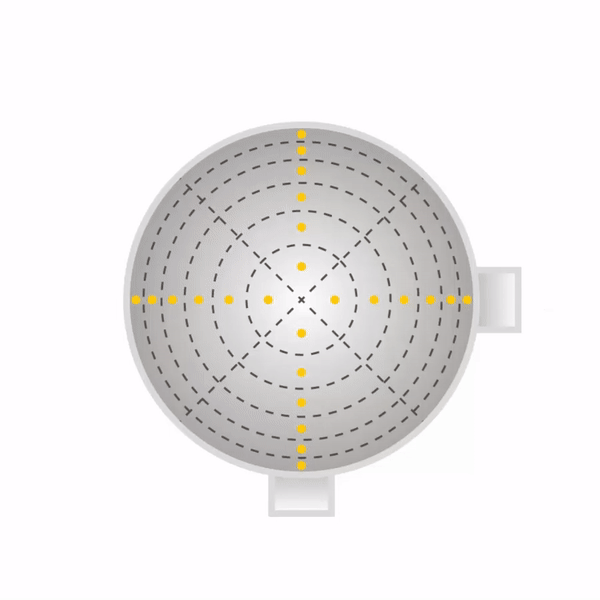
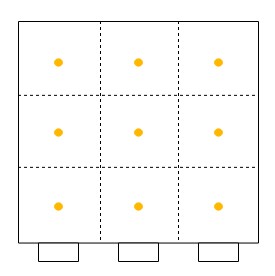
Secondly, one must sample at a number of points through each port. One must never sample at only one point, as the concentration can vary across the stack or duct. The stack or duct must be divided into equal cross-sectional areas, and the centre point of each area must be sampled as shown with yellow dots in the diagrams beneath for round stacks (left) and rectangular ducts (right). The number of sampling points depends on how many diameters the ports are away from a disturbance to flow (EPA Method 1).
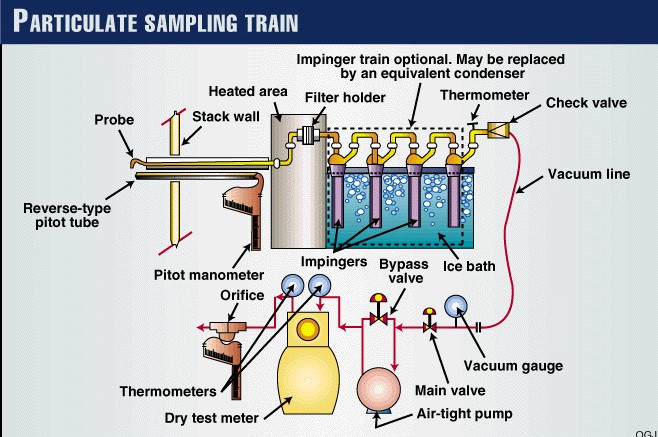
Now that the ports have been located on the stack, and the number of sampling points have been specified, one can begin sampling. One will need the following equipment as shown in EPA Method 5.
8. What is the Result of Isokinetic Sampling?
There are three things that one must obtain at the end of an isokinetic run:
1. The filter with the mass of PM.
2. The volume of gas that was sampled (and the temp and pressure of the Dry Gas Meter [DGM] that was measuring the volume).
3. The isokinetic deviance.
Using the filter mass and the volume of gas that was sampled, one has a concentration in mg/m3. However, the temperature and pressure of the DGM affect the volume that the DGM reads. Hotter gases occupy more volume; and gases under pressure occupy less volume. Therefore, it is essential that the temperature and pressure of the DGM be recorded and used to convert m3 to Nm3 at standard temperature and pressure (0ºC and 101.3 kPa). Then one has the final result in mg/Nm3.
For this result to be valid, the isokinetic deviance must be reported, and it must be less than 10 %. This is a requirement of EPA Method 5. If the isokinetic deviance is not reported or is more than 10 %, then the report must be rejected.
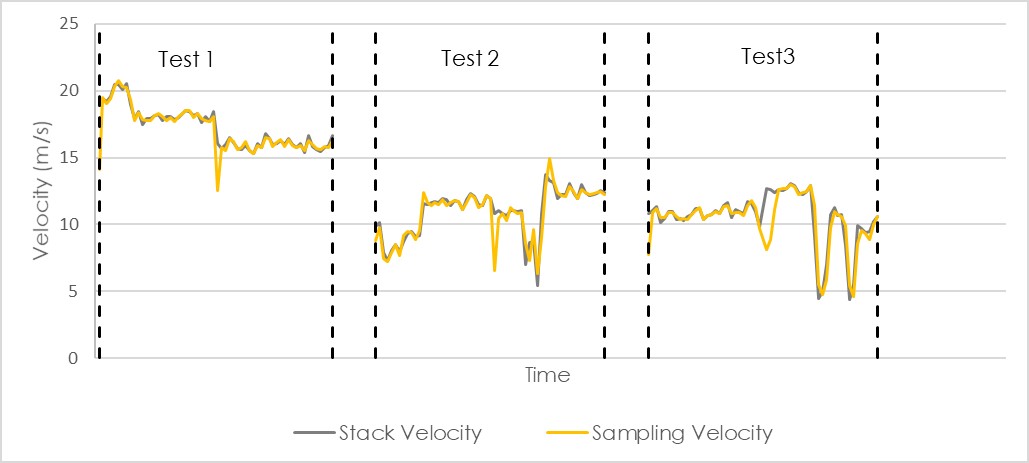
The graph beneath shows the stack velocity in black and the sampling velocity in yellow. It is clear that they were almost identical and the difference between them is far less than 10%. This company has sampled very isokinetically on this day.
9. What Mistakes are Often Made?
-
- Using a handheld sampling pump instead of the full isokinetic train shown on pages 4 and 5. A proper isokinetic train is large and can weigh up to 100 kg.
- Sampling using a plastic tube, and not a downward-facing glass/metal nozzle.
- Only testing through one port.
- Leaving the probe at a single point for the full run, instead of traversing the stack.
- Not measuring the temperature and pressure of the dry gas meter and reporting in mg/m3; and then incorrectly stating that this is mg/Nm3.
- Not matching the sampling velocity to the stack velocity (i.e. not isokinetic).
- Matching the sampling velocity to the stack velocity poorly leading to an isokinetic deviance of > 10%.
- Not using impingers to dry the gas and to calculate the water content of the stack.
10. How Can an Air Quality Officer Know if Isokinetic Testing was Done?
-
- Every testing report is required to state the isokinetic deviance of each run and the isokinetic deviance is required to be < 10%. The isokinetic deviance is the percentage by which the sampling velocity was different to the actual velocity in the stack. Search the document for the word “deviance” on your computer. If the isokinetic deviance is not reported, the report is non-compliant as the accuracy is unknown.
- Search the report for the words “constant flow” on your computer. If the report mentions that constant flow sampling was performed, then it was not isokinetic sampling. Constant flow sampling is the opposite of isokinetic sampling and is only permissible in very unique situations which would need to be well justified.
- Look at the photos in the testing report. If it looks like small hand-held pumps were used, then isokinetic testing was not performed.
- Look for the section in the report where the equipment is noted. The following brands of isokinetic equipment are acceptable: Tecora, Metlab, Apex, Dado, Clean Air, and Dr Fodisch. If the equipment is not made by one of these manufacturers, or if it was built at home, there is a significant risk that it may not be sampling isokinetically.
- Check the report to ensure that the water content of the stack is reported. If the water content was not measured, then the results cannot be reported on a dry basis and the isokinetic deviance cannot be calculated.
- Look at the table of results. If the velocity is reported as identical in every run, then it was obviously only measured once at the start of the day, and testing was not isokinetic.
- Some reports multiply the emissions concentration by the percentage of hours that the plant was operational for the day. In other words, if the emissions were 600mg/Nm3 and the plant was only operational for 8 hours out of 24, they will perform this calculation: 600×8/24=200 mg/Nm3 and report this as the daily average. This is unethical, dishonest and unscientific; but is has been witnessed in several reports of Listed Activities.
- If the subcategory in the Listed Activities requires the concentration to be normalised to a reference oxygen, then oxygen must be measured throughout each isokinetic run and it must be reported.
- If you have any doubts, you are welcome to send us the report and we will compare it to the US EPA methods.
- It is important to note that the errors above lead to incorrect results that can be hundreds or even thousands of times different from the actual value. Imagine obtaining an emissions report that states that the results are 8 mg/Nm3, when in actual fact they are 3 737 mg/Nm3. In a recent study of 26 emissions reports, only 51 % were found to be compliant with these US EPA requirements.
11. Advice
We are here to help, and our advice is always free of charge. Please email us or phone us at any time. PM2.5 was reported as leading to 3 100 000 million deaths in 2010 (World Health Organization). It is critical that we all play a part in addressing fraudulent and substandard testing in South Africa, for the sake of the health of the communities that we serve.